How to print great B&W photos (4) - generating the Gutenprint ink curves
Polynomial equations were used to express ink densities as a function of gray level in the previous part of this series of articles on B&W printing. Here we present the Mathematica notebook that can be used to generate the ink-curve values to be pasted into the Gutenprint XML printer definition file.
Calculating the ink curves for Gutenprint with Mathematica
The Mathematica notebook that I wrote for creating the C,M,Y ink curves can be downloaded using this link (please change the txt extension to nb to make it into a Mathematica notebook). The notebook is in Computable Document Format (CDF). It is intended for version 9.0 of Mathematica. You can load it into the free Mathematica CDF player that you can download from their site and get some degree of manipulation of the controls, but as a whole the document can only be used fully if you have a copy of Mathematica version 9.0 at least. It is possible to view the document in an internet browser with the CDF plugin, again downloadable for free from the Wolfram website. I have also a PDF version of the file for download, use this link. You can simply transfer the formulae into a spreadsheet and create the values that way with some effort.
Once the ink curves are set up in Gutenprint via the PhotoGP plugin, we print and measure another test strip to find out the actual output of the printer with these curves. The curves will probably need some tweaking, especially in the 90 to 100% gray areas to optimize the density without losing the dynamic range. I have found that with the above method you need to do very little tweaking in order to get decent final curve. Once that is done, it is time to create a profile for the printer-ink-paper combination with the finalized ink curves. This profile can be used to simulate the printer output on the monitor before printing.
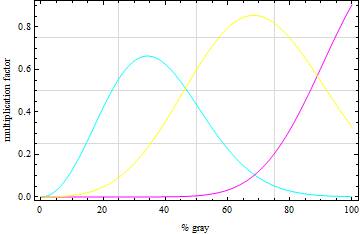
Here is a typical set of CMY curves generated by the program:

Printer profile creation
The black and white print is a special case of the colour print where the three primary colours, for a given luminosity, are very close to each other in magnitude. That is, R~G~B. Creation of a printer profile is currently not possible with ArgyllCMS because of the limited colour gamut related to the gray inks. I say limited colour gamut because the printed image using carbon inks is not completely colour neutral (that is, the a* and b* values are not zeros). So, if you use ArgyllCMS to create the profile, the matrix transformation calculations are thrown way off and the associated computational errors do not reduce to manageable levels. It would be easier to write a profile creation program using the great Little CMS package by Marti Maria. This I hope to describe in the next and last part of this series along with the final test strip printing, measuring, and other odds and ends left out till now.